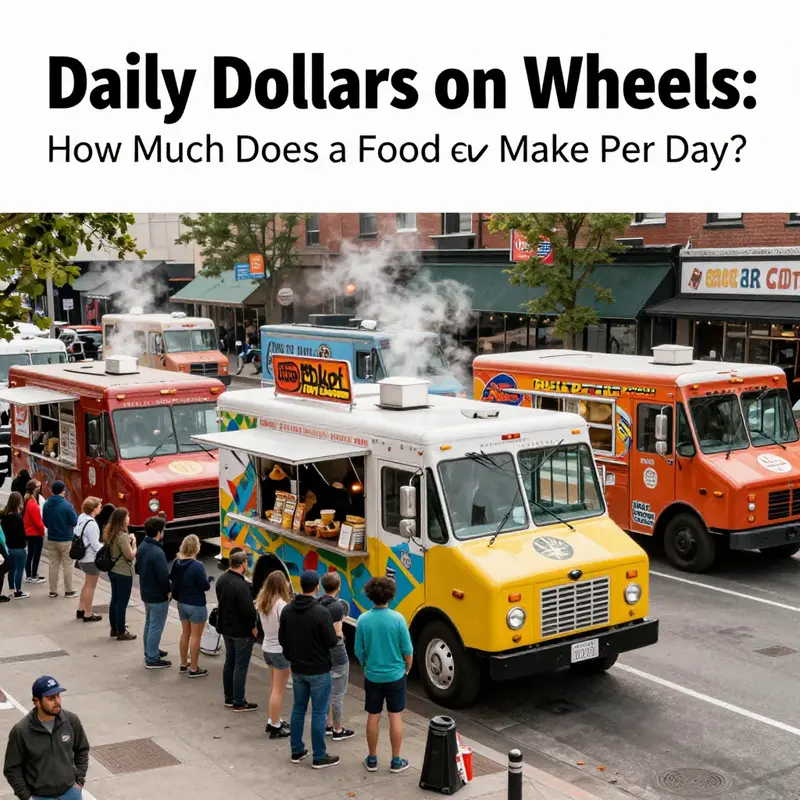
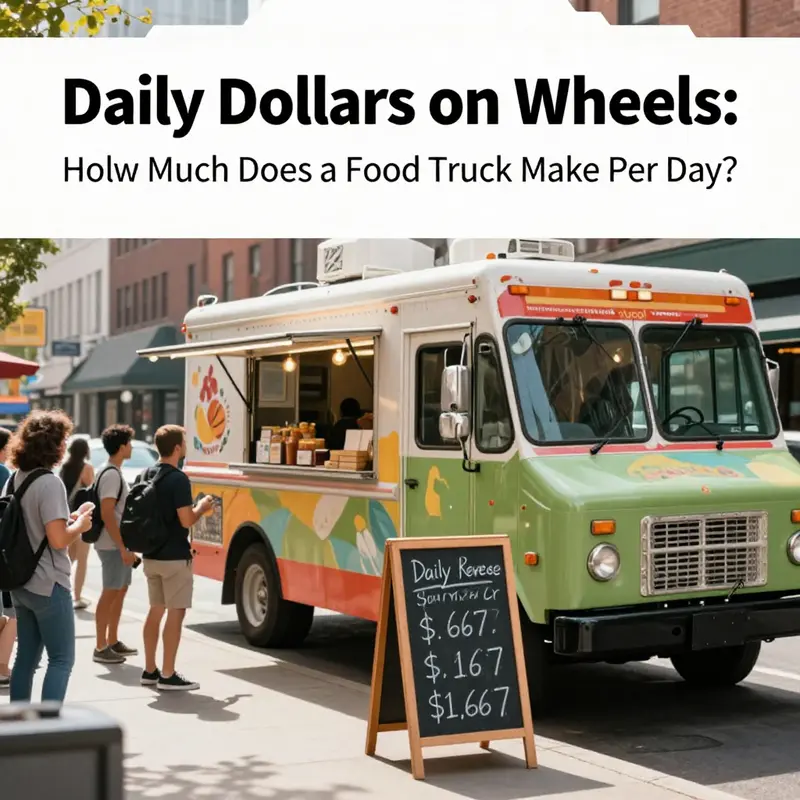
From bustling downtown streets to sunlit corporate campuses, food trucks bring energy, flavor, and revenue to everyday occasions. How much money a truck makes per day isn’t a single fixed number—it rides on where you park, when you serve, how you price your menu, and how much foot traffic you attract. On average, food trucks generate between $20,000 and $50,000 in monthly gross revenue, which translates to roughly $667 to $1,667 per day when you spread it over a 30-day month. But the real story is dynamic: peak days in high-demand urban hubs or popular events can push daily receipts past $2,000, while smaller towns or quieter spots might see $300–$500. For event planners shaping calendars, corporate teams planning employee experiences, and community groups crafting tastings and fundraisers, understanding these patterns helps with budgeting, scheduling, venue selection, and stakeholder communication. Across five chapters, we’ll map baseline ranges, explore the levers behind daily earnings, examine market variability, unpack seasonal and event-driven revenue, and offer practical benchmarks plus risk‑management tips to keep daily revenue resilient. Real-world examples and current market insights will equip you to forecast, negotiate, and design experiences that deliver both flavor and financial clarity.
Daily Earnings on Wheels: Reading Baselines, Peaks, and the Realistic Range of Food Truck Revenue
A food truck’s daily revenue is a moving target, shaped by where you park, who you serve, what you offer, and how efficiently you operate. When people ask how much a food truck makes per day, they’re really asking about a constellation of variables that shift with geography, weather, calendar, and competition. The numbers aren’t a single line so much as a spectrum. In the United States, the broad picture is that a typical day’s gross can land anywhere from a few hundred dollars to well over a thousand. On a practical level, most trucks report daily revenue somewhere between roughly five hundred and one thousand five hundred dollars, depending on whether the truck is anchored in a high-foot-traffic area or navigating quieter corners. The most successful street-food operators in dense urban centers, particularly when they have a coveted location and a strong, repeat crowd, can see daily receipts that push toward two thousand dollars or more on peak days. In contrast, trucks serving smaller towns or venues with limited foot traffic may settle into a lower band, with daily sales closer to a few hundred dollars. These ranges aren’t arbitrary; they reflect how the business behaves across the calendar and across the country’s varied landscapes.
To place these figures in a broader context, consider the typical monthly revenue framework many operators reference: a range of twenty thousand to fifty thousand dollars in gross revenue per month. When you spread that evenly across a 30-day month, you land in the neighborhood of roughly six hundred sixty-seven to one thousand six hundred sixty-seven dollars per day. That is a useful baseline for planning and expectations, but it’s important to anchor it in reality. Variability is the rule, not the exception. Seasonal swings play a decisive role. Warmer months often bring more outdoor events, markets, and festivals, along with a higher tempo of both customers and sales. Bad weather, on the other hand, can curtail foot traffic and lower daily take. Holidays and major events can create brief windfalls, while ordinary weekdays in less-trafficked areas may produce more modest days.
What drives the day-to-day variance, beyond the weather and the calendar, is a blend of location, audience, and menu design. A truck parked near a dense office district or a university campus can capture steady lunch traffic, then ride peak hours into the evening with a handful of well-chosen offerings. A truck that can move to a bustling event, fair, or outdoor market has the potential to surpass the standard daily range, especially if the operator has a track record of reliability and speed. The menu itself matters as well. High-demand items with broad appeal—think items that are easy to eat on the go, that deliver consistent quality, and that offer good margins—tend to push average ticket sizes higher. A well-balanced mix of core staples and limited-time or premium items can lift the per-customer spend and, by extension, the daily revenue. In this sense, revenue isn’t simply about the number of customers served; it’s about the average spend per customer and the speed with which a truck can turn customers into repeat sales within a given window.
Seasonality also organizes the daily numbers into a rhythm. In markets with heavy outdoor activity, summer days often shine, especially when the truck pairs with outdoor concerts, farmers’ markets, or downtown festivals. Conversely, winter days may be leaner unless there’s a steady indoor venue, a steady stream of corporate events, or a year-round food hall ecosystem nearby. And even within a single city, different neighborhoods can behave very differently. A truck parked in a business district at lunchtime may experience a different cadence than one stationed near a residential area in the evenings. The best operators learn to read these patterns quickly, adjusting hours, menu, and promotions to align with the day’s realities.
Another practical truth is that the top-line figure—the gross revenue a truck reports on a given day—can be a product of both volume and value. Volume is about how many customers come through the window and how many meals are sold. Value is about what’s included in each sale, the pricing strategy, and the mix of items on the menu. High-volume days aren’t necessarily the most profitable if the menu is low-margin or if the labor and food costs climb quickly to absorb that volume. Conversely, a day with fewer transactions but a higher mix of high-margin items can deliver healthy gross numbers with less stress on the back end. Successful operators tend to optimize both sides: attract enough customers and cultivate a menu that delivers a strong average ticket, all while maintaining a lean operation that minimizes waste and unnecessary labor.
The operational discipline behind a steady daily take matters just as much as the day’s foot traffic. Speed of service becomes a multiplier; every minute shaved off a line increases the number of orders that can be fulfilled in a shift. A queue that moves smoothly reduces the risk of lost sales due to long wait times, especially during peak periods. The layout of the truck, the efficiency of the cooking workflow, and the accuracy of the cash handling all influence the customer experience and, ultimately, the day’s revenue. A well-tuned operation can sustain higher daily figures by maintaining reliability and consistency across the board—from how quickly orders are prepared to how effectively the team communicates specials and upsell opportunities. In this framework, the daily revenue is not only a measure of customer volume but a reflection of the operator’s ability to deliver value quickly, consistently, and with quality that keeps customers returning.
If one were to frame this as a planning exercise, a realistic expectation would be to model a day across a spectrum of scenarios. A typical weekday in a mid-sized city might produce a solid mid-range result—say around six hundred to one thousand dollars—if a truck benefits from a steady stream of office workers, a reliable lunch crowd, and a handful of repeat customers who know what to expect. Add a weekend shift or a location with a proven events calendar, and you can begin to push the daily average toward the upper end of the spectrum, particularly if the menu includes items with strong appeal and good margins. Moving into the higher end of the range, occasional peak days at festivals or in premium locations can cross the two-thousand-dollar mark. These days are not the baseline; they are the exceptions that demonstrate what the business is capable of when the stars align: high traffic, a compelling value proposition, efficient service, and a strong mix of offerings that resonate with the crowd.
For operators seeking a practical framework, it helps to think about revenue in layers. Start with location and schedule—the predictable, repeatable part of the day. Then layer on the menu design and pricing strategy, which determine the average spend per customer. Finally, add the efficiency and reliability of operations—the speed, accuracy, and consistency that convert first-time visitors into loyal customers. When all three layers align, the daily revenue tends to cluster toward the higher end of the spectrum; when one or more layers falter, days can land lower than the typical baseline. This layered approach also supports planning beyond a single day. It informs budgeting, marketing, and expansion decisions. It makes it possible to forecast not just what a truck might make on a given sunny Saturday, but what it can sustain over a season, or even a year, when multiple venues and events are factored in.
The numbers, in other words, are a map rather than a verdict. They guide expectations, but they do not dictate outcomes. For a more holistic view that connects revenue to costs and profitability, many operators consult industry analyses that break down not only income but the cost structure that shapes net earnings. Such analyses underscore that gross revenue is an important measure, yet it is the relationship between revenue and costs that determines whether a day’s take translates into a viable income. The lesson from the data is not that one number defines success, but that a truck’s daily revenue sits within a dynamic ecosystem of location, timing, product mix, and operational excellence.
To further contextualize these figures and to explore practical benchmarks, it can be helpful to consult broader industry resources and guides that synthesize current market performance. For readers who want to dive deeper into cost structures, profitability, and real-world benchmarks, the following internal resource offers a thorough perspective: financial tips for first-time food-truck owners. This material complements the revenue picture with actionable guidance on planning, pricing, and efficiency that can influence daily outcomes without changing the core geography or market conditions.
As you set expectations for a new food-truck venture or evaluate an existing operation, frame the daily revenue not as a single destination but as a spectrum shaped by where you operate, who you serve, and how you run the business. A truck parked at a popular downtown corridor during lunch and then at an evening market could see a day that pushes toward the higher end, while another day in a quieter locale might sit toward the middle or lower end. The most important takeaway is clarity: know your baseline in your specific setting, understand how much you can reasonably lift that baseline through menu design and marketing, and cultivate the operational discipline that converts potential into repeatable daily performance.
For those who want a formal reference to profitability and cost structuring, external industry sources provide structured analyses of revenue versus expenses across the sector. A respected overview published by a national small-business resource presents a framework for understanding how revenue translates into profitability in the real world. This broader context helps anchor the day-to-day numbers in concrete financial planning and strategic decision-making, ensuring that daily earnings are interpreted with the right emphasis on sustainability and growth. https://www.sba.gov/blog/food-truck-profitability-what-you-need-to-know
On the Road to Real Revenue: Decoding a Food Truck’s Daily Earnings Through Location, Hours, Pricing, and Volume
Every day on the road, a food truck’s success is measured not just by the number of meals sold, but by how those meals translate into a reliable, shareable daily figure. The research paints a clear picture: daily earnings emerge from a complex mix of where you operate, how long you stay there, what you charge, and how many customers you can serve in a shift. The broadest view shows monthly gross revenue for many trucks between twenty thousand and fifty thousand dollars. When you spread that over a 30-day month, the math lands roughly in the range of $667 to $1,667 per day. But those numbers are averages, and averages conceal the real drama of a food truck’s day-to-day life. In a busy downtown corridor or near a major event, peak days can push daily receipts well past the two-thousand-dollar mark. In quieter towns or less trafficked neighborhoods, daily sales can dwindle to a few hundred dollars. The reality is that a truck’s daily earnings are a moving target, sensitive to the same forces that shape any small business operating in a dynamic street economy.
Location is the most visible lever. A prime site—think a corner near a dense office district, a transit hub, or a festival perimeter—puts a crowd at your curb before your first sizzle. High foot traffic translates almost directly into higher customer volume, and with it, the potential for higher daily revenue. The inverse is equally true: a truck parked in a spot with little pass-by traffic or competing with a large, entrenched street-food scene can cap daily receipts even if the price point is reasonable and the menu is strong. Hours matter in the same way that location does. Long hours that coincide with peak lunch and dinner windows maximize exposure to hungry buyers and the opportunity for incremental sales. That often means early set-ups and late pack-outs, especially on weekends when the appetite for street dining tends to rise and fall with events, market days, or neighborhood happenings. The fees and logistics of staying open longer—labor, energy, and fuel—need to be considered against the incremental revenue of each additional hour. The balance is not purely mathematical; it’s tactical. Managers must decide when the local scene supports sustained traffic versus when the same time could be better spent in a different zone or capped to protect margins.
Pricing is the second major determinant. A menu priced too aggressively risks turning away casual buyers, while pricing too high can erode volume and reduce overall daily earnings. The sweet spot sits where costs—ingredients, fuel, permits, labor—are covered while still delivering value relative to local substitutes and competing trucks. A cost-plus approach helps, but the most successful operators also benchmark against nearby rivals and the observed willingness of the market to pay. In times of high demand, some trucks can stretch prices modestly without sacrificing the steady stream of customers who associate the brand with predictable quality. In slower periods, price discipline paired with promotions or bundled offers can help maintain volume. These pricing moves are rarely static; they evolve with the seasons, the day of the week, and the specific event calendar in a given locale. When pricing is aligned with demand, daily revenue becomes a function of how often customers choose to buy and how much they choose to spend per visit.
Volume is the linchpin of daily earnings. The actual number of meals served per day is the most direct determinant of gross revenue, because revenue comes from price times quantity. A high-volume day emerges when a truck is visible to the right people at the right time, with a menu that resonates and consistency in service and quality that earns repeat business. Volume grows when the operator actively cultivates a loyal customer base through steady social engagement, reliable hours, and a dependable quality bar that people associate with their daily routines. The best-performing trucks do more than sell meals; they sell repeat opportunities. They use loyalty programs, targeted social updates, and timely communications about location changes, new menu items, or special deals to keep customers returning. It’s not merely about increasing the number of transactions; it’s about increasing the probability of a return visit and, in turn, the average daily spend per customer through upselling and curated combos.
A commonly cited benchmark helps frame expectations. National data suggest a median daily revenue range in the US roughly between eight hundred and twelve hundred dollars. Yet, geography matters deeply. In mega-cities like New York or San Francisco, daily receipts can lean toward fifteen hundred dollars or more on regular days, driven by higher price points in tandem with dense, diverse populations and a culture of on-the-fly dining. In smaller towns or rural areas, daily figures may sit closer to four hundred to six hundred dollars. Seasonal shifts—warmer months with outdoor activity, holidays, or major outdoor events—magnify or soften these patterns. The seasonality isn’t merely about weather; it’s about what the calendar opens up in terms of outdoor festivals, farmers markets, and corporate gatherings. Smart operators study the rhythm of their city, tracking where crowds gather and when, then align their schedule to ride those waves rather than fight against them.
With this functioning map of determinants in mind, how does a truck operator translate insights into practical action that could lift a day’s earnings? The answer lies in an integrated approach to market research, scheduling discipline, pricing strategy, and customer engagement. Thorough market research means identifying zones with high foot traffic yet lower competition and testing locations through short-term runs to collect real-world data on footfall and average spend. Scheduling around peak demand isn’t just about choosing lunch or dinner slots; it’s about understanding the micro-patterns of a neighborhood—where people congregate, how commuters flow, and when events draw lines to your window. Pricing strategies should combine a clear view of costs with a realistic understanding of what customers in a specific locale will tolerate. Sellers who layer small, frequent price adjustments with promotions, like bundle offers during slow windows and value combos during busy periods, can sustain healthy volume without sacrificing margins.
The conversation around daily earnings would be incomplete without acknowledging the role of operational discipline. Weather and regulatory constraints can carve into daily revenue in abrupt ways. A sudden rainstorm can shrink foot traffic, while permits and fuel costs eat into every hour of operation. Labor efficiency matters as much as the raw speed of service. A well-trained crew that moves quickly and consistently reduces wait times, enabling more transactions per hour and a higher daily total. In practice, every dollar of extra revenue is amplified when it is supported by efficient execution and a loyal, returning audience. The mathematics of daily earnings become tangible when operators model a day as a sequence of potential customers, each with a probability of purchase and a typical spend. A simple way to frame this is: total daily revenue equals the number of potential customers times the probability of purchase times the average price. Then, subtract fixed and variable costs to arrive at net earnings. While the numbers will shift with location and season, the framework remains stable: more customers, higher conversion, better pricing, and tighter cost control collectively lift the daily figure.
For operators just starting to calibrate their own daily income, a practical touchpoint is to visit resources that outline budgeting and pricing in the context of mobile food businesses. A reliable starting point can be found in practical guidance on first-time truck ownership, which delves into budgeting, pricing strategy, and market analysis. This kind of resource helps translate the theory of location, hours, pricing, and volume into concrete daily targets and steps for achieving them. As operators test ideas, they should view daily earnings as a movable target rather than a fixed ceiling, adjusting expectations as they gather data from real-world runs, events, and changing competitive landscapes. The core insight remains: daily revenue is not a single number but a dynamic outcome shaped by where you stand, when you work, how you price, and how many customers you turn into buyers each day.
For readers seeking additional context beyond the day-to-day dynamics, broader industry sources offer ongoing benchmarks and practice-informed guidance. To start, consider the budgeting and pricing perspectives shared by experienced truck operators, and, as a reference point, look to national-scale datasets that illuminate how regional differences shape daily results. If you want a practical, grounded path to apply these ideas, you can read more about budgeting and pricing strategies in the linked resource on first-time food truck ownership. financial tips for first-time food truck owners.
Finally, the Bigger Picture: the daily earnings figure does not exist in a vacuum. It is the fruit of ongoing execution—every day’s choices about where to park, how long to stay, what to charge, and how hard to push volume. Savvy operators test, learn, and adapt. They study foot traffic patterns, monitor competitor activity, and iterate on menu items that prove most appealing in their locale. They build communities around their brand so customers feel a sense of belonging and loyalty that translates into repeat business. They treat each day as a small experiment with a clear objective: convert more passerby into paying customers without compromising quality or speed. In this way, daily earnings become more than a number; they become a signal of how well a truck is integrated into the local economy and how consistently it can serve a hungry city on wheels.
External resource for broader guidance: for additional budgeting and small-business planning perspectives, consult the U.S. Small Business Administration at https://www.sba.gov.
Riding the Daily Tide: How Peak Hours, Urban Hotspots, and Off-Peak Performance Shape Food Truck Revenue
The daily earnings of a food truck follow a rhythm set by people, places, and calendars. It is not a straight line from morning to night, but a fluctuating tide driven by location, hours, pricing, and the seasons. When you total a month’s sales across a 30-day cycle, the typical picture becomes a band: gross monthly revenue often falls between $20,000 and $50,000. That translates to roughly $667 to $1,667 per day if you’re dividing the month evenly. But averages hide the real drama of daily highs and lows. The same truck that clocks a modest weekday lunch in a steady neighborhood can, on a single peak day, push much higher, or dip to a fraction of that on a rain-soaked, out-of-town or off-event day. Understanding that day-to-day variability is essential for budgeting, staffing, and forecasting, and it helps answer the core question: how much does a food truck make per day? The short answer is: it depends, and a lot of the variation rides on where and when you operate, and how you use the moments when crowds gather.
In urban hotspots, the numbers tend to swing more widely and more dramatically. On a typical busy day in a well-managed operation, daily revenue can land in the range of $1,500 to $3,000. That range reflects the power of a well-timed lunch rush, steady foot traffic, and the ability to convert steady lines into solid sales through menu design, pricing strategy, and speed of service. When a truck finds itself near a festival, a major concert, a holiday market, or a dense office corridor during peak hours, the same truck can push beyond $4,000. These days hinge on a perfect alignment of audience, timing, and capacity. It’s not just people; it’s the ability to process that demand quickly enough to prevent lines from throttling the flow of customers.
The other side of the spectrum matters just as much. Off-peak performance, which can stretch across weekday afternoons in quieter districts or evenings in less-trafficked areas, often settles into a more modest band—roughly $300 to $600 in a day. These quieter windows are not a sign of failure but a reminder of the seasonality and the market’s natural cadence. A truck that routinely earns under $500 on certain days may still find solid profitability in the margins, if the business is priced to sustain labor costs and ingredient waste is kept to a minimum. The contrast between peak and off-peak days is not just about volume; it’s about the quality of each sale, the speed of service, and how efficiently the operation converts busy periods into higher margins.
Several factors shape where a truck sits within these ranges. Location and demand density are at the top of the list. A prime downtown site near office buildings, transit hubs, or a cluster of high-traffic venues can sustain higher sales levels because the foot traffic is dense, predictable, and repeatable. In markets with a robust truck culture—cities where residents expect and plan for mobile food options—the baseline daily revenue tends to be steadier, even as competition for the best spots remains fierce. The geography matters, too. In larger metros with a deep pool of potential customers, there is more capacity to sustain higher daily receipts, but also more competition to secure the right corner, curb, or parking lot at peak times.
Market size and geography interact with culture and competition in nuanced ways. In smaller markets or rural settings, foot traffic may not reach the same volumes without a distinctive offering or a special event calendar. A truck that differentiates itself with a unique cuisine or a signature preparation can carve out a lucrative niche even where there are fewer people walking by. The trick is not just drawing people in once but building a reputation that makes them return and bring friends. That kind of loyalty helps smooth some of the day-to-day volatility by creating predictable lines at certain hours, even when the overall market is quieter.
Seasonality and events inject another layer of variability. Festivals, fairs, concerts, and seasonal markets can create spike days that dwarf ordinary operations. A single well-timed appearance can deliver a gust of revenue and exposure that pays for weeks, but the opposite is true as well: bad weather, post-holiday lulls, or off-season slowdowns can dampen daily receipts. For operators, this means planning around calendars—knowing when major events are scheduled, which dates are likely to attract crowds, and how much inventory to prepare for those windows. It also means building flexibility into the business model. Some operators hedge risk by diversifying locations, adding extra hours during event seasons, or coordinating with nearby venues for joint promotions that keep the crowd flowing even when the weather or competitors shift expectations.
The competitive landscape also matters. In cities with well-established food-truck ecosystems, with vibrant street-food cultures and consistent customer bases, operators often enjoy stronger demand but also face more intense competition. The guidance here is practical: choose locations with density of demand and a realistic sense of how crowds move. The most successful trucks are those that optimize location, hours, menu, and the speed of service to exploit the peak windows—ensuring the high-margin periods translate into meaningful daily earnings rather than fleeting bursts. Conversely, in markets with less crowd density, differentiating through a distinctive offering—or synergy with a fixed location like a corporate campus or university—can push daily revenues higher than what sheer volume would predict.
From a planning perspective, these numbers offer a set of benchmarks to inform decisions about where to park, when to operate, and how to price. If the goal is predictable, steady income, a truck might target a reliable daily range closer to $1,000 to $1,700 on most days, acknowledging that events and lunch hours can push those figures higher. If the aim is maximum upside, the operator should cultivate peak-day strategies: secure premium spots, align schedules with event calendars, maintain a streamlined operation that can serve large crowds quickly, and price items to capture high demand without sacrificing volume or quality. The margins on high-volume peak days can be significantly better than on off-peak days, but they demand near-flawless execution and precise inventory control.
This variability doesn’t absolve a truck of the need for disciplined financial planning. In practice, operators integrate these patterns into budgets, cash-flow projections, and staffing plans. A realistic forecast will account for a mix of days—some that deliver the comfortable, steady revenue bands and others that represent the big surge. The best operators build buffers for the slower days, while preserving the capacity to scale up quickly when a festival or a corporate event creates a spike. The objective is not to chase every peak but to earn consistently through a well-timed combination of presence, pricing discipline, and operational efficiency. It’s the difference between a lunch rush that feels like a sprint and a daily routine that sustains a business across weeks and months.
For readers seeking actionable planning guidance that translates these benchmarks into practical tactics, consider resources focused on budgeting and financial planning for first-time food-truck owners. Financial tips for first-time food truck owners offer strategies to structure pricing, manage inventory, and forecast cash flow with the variability described above. These insights help translate daily revenue ranges into real-world profitability, ensuring that peak-day gains contribute to a resilient business rather than bright but brief spikes in earnings. The daily tide is real, and with careful placement, smarter hours, and a disciplined approach to cost control, a food truck can ride the waves rather than be swamped by them.
In the larger context of small-business earnings and self-employment trends, the variability described here reflects broader patterns documented by national statistics and industry analyses. The Bureau of Labor Statistics tracks the dynamics of small businesses and self-employment and provides a macro lens on how earnings can fluctuate across contexts, seasons, and markets. This broader perspective helps situate a single truck’s daily numbers within the economic rhythms of a larger ecosystem and reinforces the idea that variability is the norm—one that thoughtful planning can transform into a reliable, livable income. External context can be found in broader reports on small-business performance and self-employment trends, which place the microeconomics of a single truck within a wider economic landscape. https://www.bls.gov/opub/ted/2023/ted_20230728.htm
null
null
From Lunch Rush to Daily Revenue: Reading the Real-World Earnings of a Food Truck
Every food truck operator eventually faces the same question in a straight line: how much does a day actually bring in, and how much of that becomes profit? The short answer is that daily revenue is a moving target. It rides on the coattails of location, timing, and crowd behavior, and it shifts with the weather, the season, and the rhythm of the city. The broader market numbers give a framework: monthly gross revenues commonly land in a wide band, roughly between twenty thousand and fifty thousand dollars. When you divide that across a 30‑day month, the math suggests about six hundred sixty-seven to one thousand six hundred seventy dollars in gross daily sales. But those figures are averages, not destinies. Real life is louder than averages. In a bustling urban core, a food truck can exceed two thousand dollars in a single peak day, especially during lunch crowds, street festivals, or corporate park events. In quieter corners—smaller towns, residential neighborhoods, or off-peak hours—the daily numbers can dip toward the low hundreds. The variability is not just geography; it is time itself, with seasonality and competition shaping the daily script as surely as any menu item on the truck.
To get a sharper feel for what operators actually see, it helps to anchor the discussion in two broad, practical ranges. In a well-managed operation operating in a high-traffic urban environment, gross sales often land in a window roughly between eight hundred and one thousand five hundred dollars per day. This range reflects steady traffic, efficient service, and a menu designed to move quickly. Yet, in markets with lower footfall or stiffer competition, a day can look quite different—three hundred to five hundred dollars is not unusual. The contrast is not just about street corners; it’s about cadence. A truck parked near a dense business district during lunch might ride commuter waves that spike midday, while a truck serving residential neighborhoods could experience more consistent but slower foot traffic throughout the day. The same truck may also ride a seasonal wave: summer festivals and winter markets can buoy daily totals in ways that a quiet spring or fall cannot.
These daily rhythms align with the broader revenue picture that many operators model. When you translate the monthly gross into a daily expectation, you’ll encounter both ends of the spectrum: the safety of an ongoing, predictable day and the volatility of a peak day that can briefly exceed expectations. The variability is not casual; it is a function of location economics and the choices a crew makes about where to park, when to operate, and how to price and scale the menu. The lunch hour near a financial district, the quick-service cadence of a busy campus, or a weekend festival on a downtown grid—each scenario carries its own sales tempo and its own set of risks and rewards. The lesson here is not to chase a single number but to understand the distribution of outcomes and build resilience into daily operations.
A central driver of daily earnings, beyond foot traffic, is the overhead that eats into gross revenue and determines what actually lands in the cash drawer as net profit. Fixed expenses—fuel, routine vehicle maintenance, insurance, licensing, and permits—must be paid regardless of how many meals are sold. They create a floor that daily revenue must cover before any profit can be realized. Then there are variable costs tied to the act of making and selling food: ingredients, packaging, napkins, utensils, and the inevitable waste that comes from imperfect forecasts and fluctuating demand. The more a truck owner can source locally, align menus with seasonality, and negotiate favorable supplier terms, the tighter the margins can stay on busy days. But the flip side is important: relying too heavily on variable costs can destabilize daily revenue. A sudden price shift from a supplier, a miscalculation in portioning, or a spike in fuel costs can erode a day’s profitability just as quickly as a bumper lunch rush inflates gross receipts.
Labor costs sit in the same balancing act. A solo operator can save on wages, but fatigue and slower service during peak hours can blunt the impact of the busiest times. Hiring staff introduces labor that can scale throughput but also adds fixed weekly costs. A smart operational model uses a lean staffing plan optimized for the expected daily crowd: enough hands to keep lines moving, but not so many that a slow day becomes a drag on profitability. The most resilient operators design routines and checklists that keep speed and quality consistent, regardless of the day’s volume. They build in contingencies for typical disruptions—two backup power sources, spare equipment, and a small inventory cushion—so a minor equipment snag or weather shift doesn’t derail a day’s earnings entirely.
The decision framework for daily revenue also hinges on pricing strategy and menu discipline. A truck’s price structure should reflect both the cost of goods and the customer’s perceived value in that moment. In high-traffic zones, menu items priced to balance speed of service with margin can capture high-volume sales without sacrificing quality. In residential areas, simple, repeatable menu items with reliable yields can sustain steady sales across the day. The best operators test small price variations and monitor how demand responds, using daily sales data to refine offerings for future shifts. This is where analytics, even in a rudimentary form, becomes a daily tool rather than a quarterly luxury. Tracking which locations, which times, and which menu items drive the most consistent cash inflows allows operators to shift routes, fine-tune portions, and trim waste. It is a practical realization of the principle that repeat business stabilizes daily revenue: a loyal customer base buys more often and helps smooth out the inevitable ebbs and flows of street commerce.
The narrative of daily earnings would be incomplete without acknowledging the role of risk and resilience. Weather is a constant disruptor, from scorching sun to sudden downpours. Equipment failures threaten service speed and, with it, customer satisfaction and repeat business. Regulatory shifts—whether fee changes, permit renewals, or updated health and safety standards—can impose last-minute cost or time burdens. The most successful operators treat these risks as part of the business model rather than as rare contingencies. They diversify location strategies to avoid overreliance on a single hot spot, maintain spare parts and backup power sources, and cultivate relationships with multiple vendors and suppliers to prevent supply shocks. They also invest in data-informed decision making: tracking daily sales by location, time, and weather, then adjusting the menu or pricing in response. Digital marketing and simple loyalty programs can convert occasional passersby into returning customers, which reduces the volatility of day-to-day revenue and helps stabilize income across seasons.
In practice, the math behind a single day’s revenue is a blend of art and science. The art is in reading the street—where crowds form, how long they stay, and what they are willing to pay for the quick, flavorful experience a truck provides. The science is in the numbers: margin management, cost control, and purposeful pricing tied to real-world data rather than guesswork. When these elements align, a truck does not just survive a busy day; it can meaningfully contribute to a sustainable monthly arc of profits. It is common for operators to see days that far exceed the baseline and days that fall short, but the pattern that emerges from disciplined operation is a trackable, repeatable ability to turn traffic into steady cash flow.
For readers seeking concrete, benchmark-style benchmarks, the broader industry literature often triangulates around these realities. A high-traffic, well-run truck may achieve eight hundred to fifteen hundred dollars in gross sales on a typical workday, while in less busy markets the day’s total can hover in the three-to-five hundred range. This duality is not a warning but a reminder: a daily revenue forecast should reflect the specific market, season, and operational plan you are pursuing. It should also acknowledge the importance of cost discipline and customer retention as the levers that convert gross revenue into real profit. If you want practical, field-tested guidance tailored to your situation, you can turn to financially focused resources that discuss budgeting, forecasting, and cost control for first-time owners. For example, a detailed exploration of financial tips for first-time food truck owners provides actionable steps to align revenue expectations with actual expenses and to build resilience against volatility. Financial tips for first-time food truck owners.
As you plan, remember that the daily number is not a single truth but a spectrum tied to place, time, and strategy. Operators who navigate this spectrum successfully do so by pairing a realistic daily revenue mindset with a disciplined approach to cost, service quality, and risk management. They use data to chart routes that balance busy windows with sustainable workload, price products in a way that supports margins without sacrificing appeal, and nurture repeat customers through loyalty and consistent experience. In the end, what a day yields at the register is less about chasing a perfect figure and more about building a dependable engine that can run well across the month, season after season. For readers who want a deeper dive into benchmarks and financial modeling tools tailored to mobile food businesses, the U.S. Small Business Administration offers a comprehensive starting point and practical frameworks to guide planning, forecasting, and management. https://www.sba.gov/business-guide/plan-your-business/start-a-food-truck-business
Final thoughts
Understanding how much a food truck makes per day is about more than counting receipts. It requires reading the map of location, timing, menu value, and audience. By recognizing baseline ranges, identifying the key determinants, anticipating peak and off-peak dynamics, planning for seasonal and event-driven spikes, and applying practical benchmarks and risk controls, planners and operators can craft agendas that maximize impact while preserving predictability. The result is a nimble roadmap: align site choice with audience, optimize hours and pricing for the moment, and cultivate experiences that turn first-timers into loyal guests who keep the daily revenue curve steady and sustainable.